(Variable reluctance sensors and signal conditioning: last updated by Benjamin on March 9, 2024)
Variable reluctance sensors (VR) are used to detect the passage of a ferromagnetic material near the sensor. They are also called variable reluctance inductive proximity sensors. They are frequently used to measure the rotational speed of an engine or to indicate the angular position of a rotating shaft at a specific time.
What is reluctance?
Reluctance is a physical quantity that characterizes the resistance of a magnetic circuit to the passage of magnetic flux. For example, the magnetic flux lines are established in the air gap of a permanent magnet (which constitutes a magnetic circuit) with a high reluctance because the magnetic permeability of the air is very low.
This reluctance becomes extremely low if a piece of soft iron is placed in contact with the two poles of the magnet. It will be intermediate if the same piece of soft iron is placed in the air gap of the magnet without coming into contact with the latter. Of course, the magnetic field is also modified.
Variable reluctance sensors
VR sensors take advantage of this magnetic property. They combine a permanent magnet and a coil. The diagram below (fig. 1) represents such a sensor. The core of the coil is placed near a rotating gear.
Each time a tooth passes near the sensor, the reluctance of the magnetic circuit generated by the permanent magnet is modified. Therefore, the magnetic field is also modified. This induces a current in the coil and, thus, a voltage signal.
The frequency and amplitude of the signal are proportional to the rotation speed. The amplitude is inversely proportional to the thickness of the air gap between the sensor and the teeth of the wheel. Therefore, the main disadvantage of this sensor is that it cannot detect movements that are too slow or too distant.
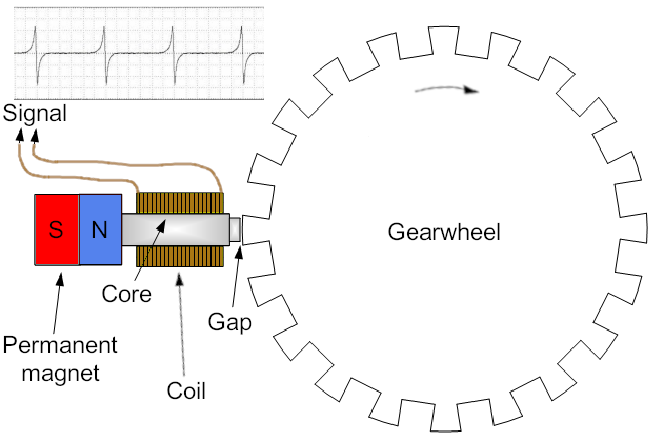
The direction of rotation does not modify the signal. In the example in the figure above, if you want each period to start with the negative part, you must swap the sensor wires and not change the gear wheel’s rotation direction.
Experimental device
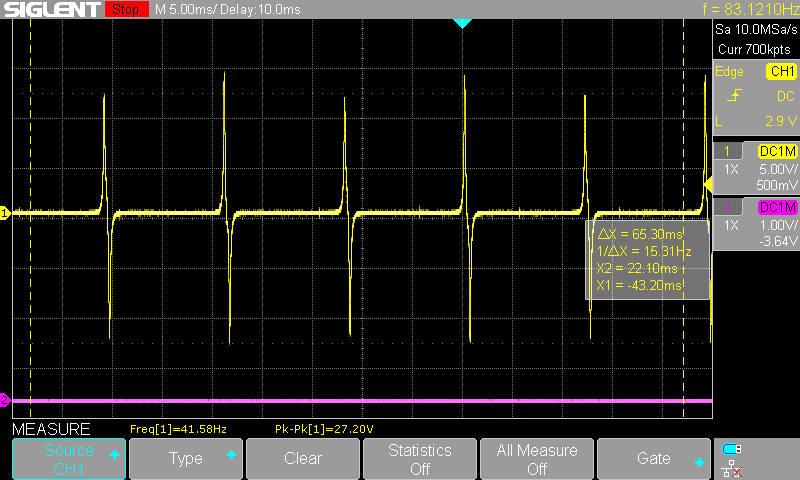
Experimentally, it is easy to study the signal from an inexpensive commercial sensor using the device below (fig. 2). A plywood disc is equipped with two identical small steel pieces, diametrically opposed. After checking the balancing, the disc is set into rapid rotation using a column drilling machine. The sensor is placed as close as possible to the disk.

Figure 3 illustrates the resulting signal. This oscillogram shows that every other period has a slightly smaller amplitude than adjacent periods. Indeed, one of the two small steel pieces is somewhat further from the edge of the disc than the other.
Rotax engine variable reluctance sensors
The Rotax 91x engines have five VR sensors: one to measure the engine rotation speed (intended for the rev counter) and the other four to synchronize the dual electronic ignition with the crankshaft’s position.
Each of these sensors delivers a single pulse per revolution, considering the geometry of the flywheel: the two indentations of the flywheel (red and green) are not in the same plane. The red and green sensors are offset in the same plane as the identically colored indentation. This is illustrated by the animation below (fig. 4). Note also that the two indentations of the flywheel are not diametrically opposed, considering the positions of the VR sensors.

Resulting signal
The signal obtained from the rev counter sensor is shown in the figure below (fig. 5). The amplitude depends on the rotation speed. The Rotax documentation indicates an amplitude of around 100 volts at the maximum authorized speed (load 100 kΩ).

One of the sensor wires is connected to the ground in the aircraft where this oscillogram was produced. The oscilloscope input was connected to the other wire (and to the ground). We see that it is not “the proper wire” that has been connected to the ground: each period begins with its negative part. Therefore, zero crossing occurs when the direction is rising.
Specific signal conditioning circuits (the rev counter input stage, intended to convert this analog signal into a square digital signal) would be deemed to work better when the signal starts with a positive part and, therefore, when the “zero crossing” occurs in the falling direction. We did not notice this phenomenon. We did not have to reverse the wires of this sensor.
Signal interference
We notice some interference in the signal: the baseline is frankly wavy. However, on close observation, these ripples are periodic and identical during each period. They are most probably linked to the rotating metallic masses near the sensor. In particular, there is a more prominent peak in the middle of the period whose amplitude can reach almost 10 volts.
This secondary peak is undoubtedly linked to the passage of the steering wheel’s indentation, which is shifted into the other plane. We will see further that this must be carefully considered in the design of the signal conditioning circuit; otherwise, this secondary peak could result in measuring a rotation speed twice the actual speed.
It is possible that this fairly significant “interference” is linked to the fact that one of the sensor terminals is connected to the ground. Such an arrangement is equivalent to using a “single-ended variable reluctance sensor,” that is to say, a sensor with a single output wire, the other terminal of the coil being internally connected to the ground of the sensor. With a “differential variable reluctance sensor,” the sensor is isolated from the ground, and the two wires coming out of the coil are connected via a twisted pair to two differential inputs of the signal conditioning circuit, which gives much better electromagnetic immunity.
The sensor used for our initial experiments (photo below, fig. 6) is a differential sensor with two wires, just like the VR sensors on Rotax engines.

What about Hall effect sensors?
VR sensors are passive components that do not require power and provide an analog signal. They should not be confused with Hall effect sensors, which are sometimes used for the same purpose. Hall effect sensors are active components requiring power; they have three wires: ground, power, and signal.
The main advantage of Hall effect sensors is that they deliver a digital signal that does not require any particular conditioning before connection to a microcontroller (subject to compliance with input voltage). However, they are more complex and significantly more fragile than VR sensors, which are reputed to be indestructible and particularly reliable in an internal combustion engine’s thermal and vibration environment.
Signal conditioning
Conditioning the signal from a VR sensor is essential before any processing by a microcontroller. This is done to efficiently and reliably convert this high-voltage analog signal into a clean square signal, free of interference, of identical frequency, and with an amplitude compatible with the inputs of a microcontroller.
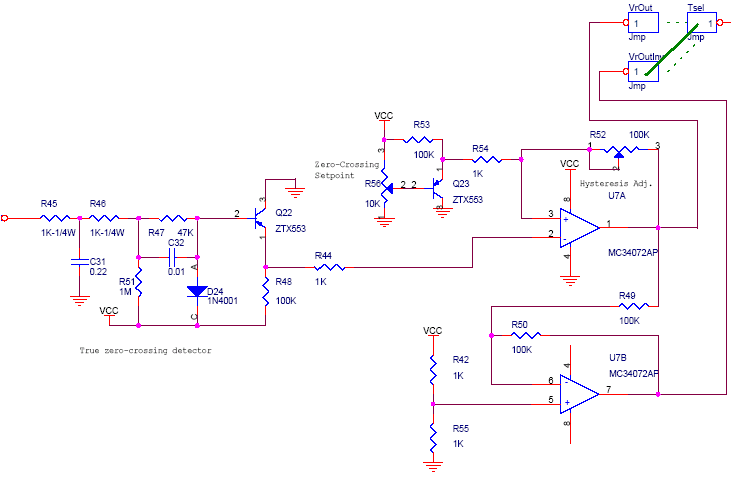
Converting a noisy analog signal of more than 100 volts with variable amplitude and frequency into a TTL/CMOS-type signal is a challenging task. See below (fig. 7) an example of a rev counter input circuit used in an older version of a MegaSquirt ECU. This circuit, which had many components, did not only use discrete components. It already included an integrated circuit, namely a double-operational amplifier.
Integrated solutions
Several electronic component manufacturers now produce integrated circuits specially dedicated to VR sensor signal conditioning. Namely Texas Instruments with the LM815, Onsemi with the NCV1124, and Maxim Integrated with the MAX992x family.
The LM815 is the oldest one. The Mega/MicroSquirt and Speeduino sites seem to have abandoned it. We did not test it.
We tested the NCV1124 without success. Even in experimental conditions, with a generator delivering a signal free of interference, it was impossible to determine the correct adjustment of the external components allowing reliable and reproducible measurement of the engine rotation speed over the entire range from 0 to 6000 rpm. One setting was suitable for low revs but “stalled” from 4000 or 4500 revs. Another one could “go up” to 6000 revs but did not take into account lower revs. The NCV1124 is only suitable for “single-ended” VR sensors. It does not have a differential input.
Flight tests with an assembly based on the NCV1124 proved very disappointing, leading to the adoption of another solution. These poor results were perhaps due in part to a bad design on our part and in part to the noise noted on the VR sensor circuit of the aircraft used for the tests.
At the time of flight testing, we had not yet analyzed the signal from the VR sensor with an oscilloscope. So, we did not spot the secondary peak that occurs between the main peaks during each period. Therefore, we could not have been able to adapt our circuit accordingly. In fact, we noted several times that this peak “triggered” the NCV124, which resulted in a doubling of the RPM.
Below is the same oscillogram as above, but with the NCV1124 output in the second trace, in purple (fig. 8). We can clearly see the deleterious effect of this secondary peak. Another disconcerting element with the NCV1124 is the absence of correlation observed on the oscilloscope, under certain conditions, between the zero-crossing of the signal and the digital signal obtained at the output. When to all this is added a certain lack of clarity of the datasheet, despite an associated application note that is not much clearer, and the fact that we have not found any user or defender of this circuit on the Internet, it can be easily understood why we abandoned any further attempt to use it.

The MAX9924 circuit
Therefore, we chose the solution from the MAX992x family, particularly the MAX9924. This circuit’s differential input increases immunity against electromagnetic interference. A single input is also possible for single-ended sensors.
The included precision amplifier and comparator allow signals up to 300 volts to be accepted as input as well as very low amplitude signals and allow high precision detection of zero-crossing, as we were able to verify with the oscilloscope. Finally, this circuit is equipped with an internal mechanism for adapting the threshold peak. This means that after a pulse of amplitude x, no subsequent pulse of amplitude less than x/3 will be taken into account. This mechanism self-deactivates after 85 ms. This is of great interest for processing very noisy signals.
The circuit’s supply voltage is 5 volts, but the open-drain output with an external pull-up resistor to a voltage of the user’s choice allows this output to be connected to any microcontroller regardless of its voltage logic, 5 or 3.3 volts.
An important point to understand concerns the internal protection of the inputs by integrated clamping diodes, as seen in the extract below from the functional diagram of the datasheet (fig. 9).
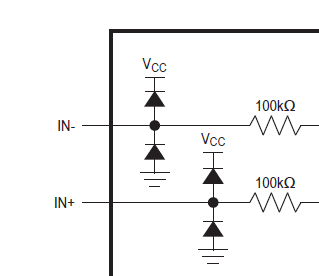
These diodes prevent the voltage applied to the following stages of the integrated circuit from leaving the range between 0 and Vcc (5 volts). This can paradoxically limit the interest of the adaptive peak threshold. Indeed, we can take the example of the signal from our VR sensor, with its secondary peak whose amplitude can reach 10 volts peak to peak at high speed. We understand that by directly applying this signal to the input of the MAX9924, there is a risk that the main peak and the secondary peak are both clipped at 5 volts by the diodes, and therefore, both are equally taken into consideration.
We were actually able to demonstrate this experimentally with a waveform generator and a custom waveform specifically designed for this test, with a high and a small peak. This led us to complete the input stage of the rev counter of the EMS AvionicsDuino with a voltage divider calculated so that at idle, the higher peak maintains sufficient amplitude, and at maximum speed, the amplitude of the small peak remains below the adaptive peak threshold, i.e., 1/3 of 5 volts.
The MAX9924 has another major advantage: it has several operating modes. It can also be used for positive signals without zero crossing, such as those generated by the tachometer output of the electronic ignition units or those of the fuel flow sensor. The datasheet poorly documents this option, but the detailed description of the MAX9924 evaluation kit explains it well.
We experimentally tested all these different modes before finally deciding to use the MAX9924 as a universal input stage for all periodic signals processed by our EMS, namely the rev counter signals generated from the Rotax VR sensor or the electronic ignition units and the fuel flow sensor signal.
Engine VR sensor input stage
Below is the diagram of this input stage in the AvionicsDuino micro-EMS (fig. 10).
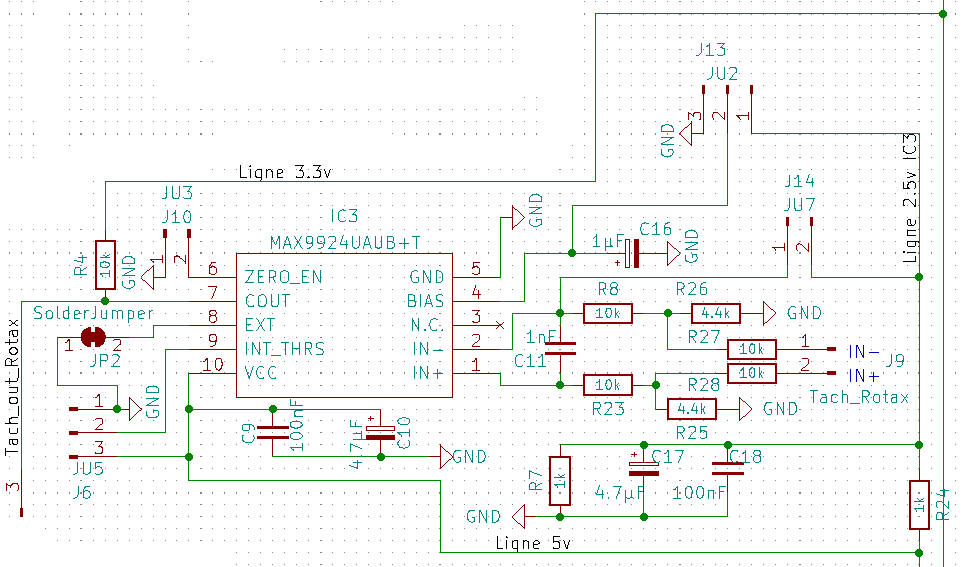
This diagram is based on data from the datasheet and from the evaluation kit instructions. It is equally suitable for single-ended and differential VR sensors. Jumpers allow adjusting the configuration.
We immediately notice the resistors R26 (4.4k) and R27 (10k) on the one hand and the resistors R25 (4.4k) and R28 (10k) on the other hand. They constitute the input voltage dividers mentioned above, which provide the necessary and sufficient attenuation so that the secondary peak of the signal does not risk triggering the circuit.
Configuration for a single-ended VR sensor
The MAX9924 is then configured in its A1 mode. See the datasheet.
The attenuated signal coming from the IN+ pin of connector J9 is applied to the IN+ pin of the MAX9924, via the 10k resistor R23.
The IN- pin of connector J9 is left floating.
- JU7/J14 jumper: shunt installed across pins 1-2,
- Another shunt connects pins 1-2 of JU2/J13 so that the IN- input and the BIAS pin of the MAX9924 are connected together and to the 2.5-volt line coming from the voltage divider made up of the two resistors R7 and R24 of 1k between ground and the 5V line. With such an assembly, triggering is not linked to zero crossing but to crossing with a positive voltage of 2.5 volts.
- A shunt is installed across pins 2-3 of jumper JU5/J6, which connects the INT_THRS pin to Vcc.
- JP2 is closed by a solder bridge, which connects the EXT pin to the ground.
- Finally, the JU3/J10 jumper remains open, the ZERO-EN pin is floating.
The COUT output (also called Tach_Out_Rotax on the diagram) is pulled to 3.3 volts by the 10k pull-up resistor R4, then connected to a digital pin of the microcontroller.
Configuration for a differential VR sensor
The MAX9924 is then configured in its A2 mode.
The two terminals of the VR sensor are connected to the IN+ and IN- inputs of connector J9. The direction of connection has no impact on operation. From there, the signal is attenuated as explained above, then applied via resistors R8 and R23 to the IN+ and IN- inputs of the MAX9924.
The jumper configuration is as follows:
- JU7/J14 open.
- JU2/J13: shunt across pins 2-3. Therefore, the BIAS pin is grounded.
- JU5/J6: shunt across pins 1-2. Therefore, the INT_THRS pin is grounded.
- JP2 is closed by a solder bridge. Therefore, the EXT pin is grounded.
- JU3/J10: shunt across pins 1-2. Therefore, the pin ZERO_EN is grounded.
Considering the properties of the MAX9924, this integrated circuit is also used as an input stage for the other periodic signals used by the EMS AvionicsDuino, namely the TACHO signal coming from the electronic ignition units and the signal coming from the fuel flow sensor.
Electronic ignition units TACHO output input stage
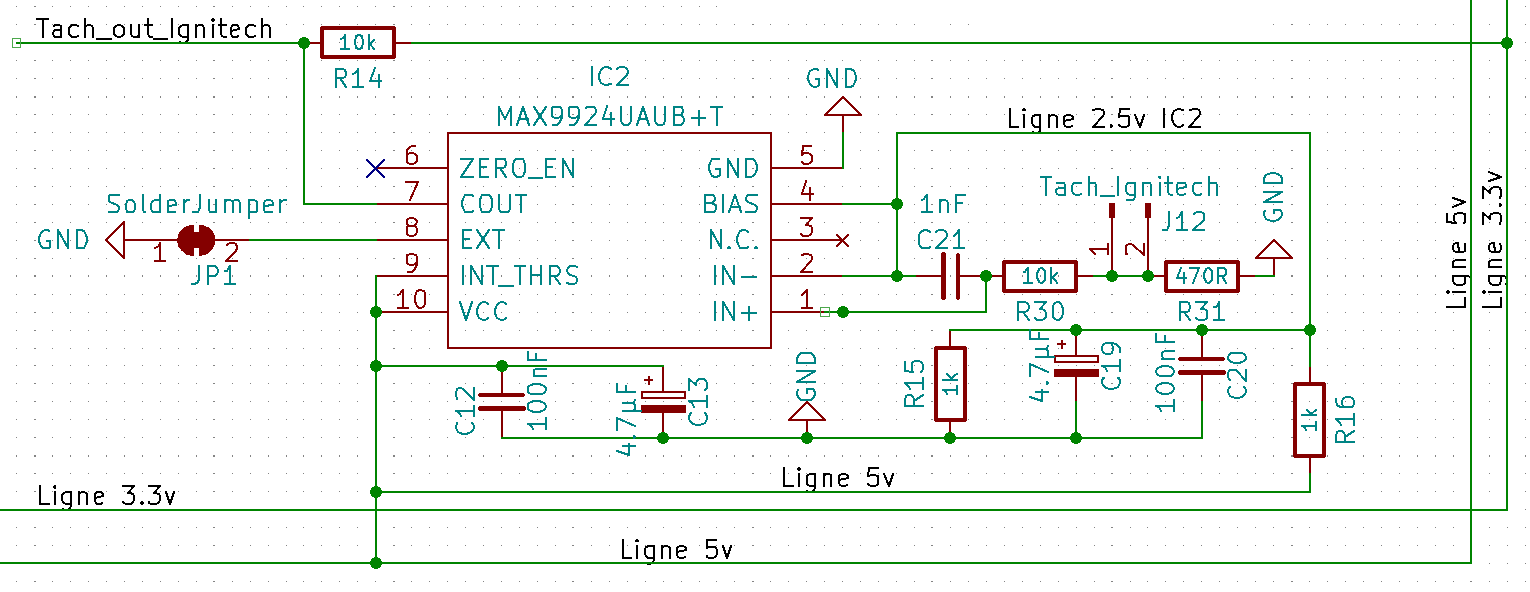
The Mode A1 configuration is used with a single input. No jumper is necessary since, with this type of sensor, no subsequent change of mode is to be expected. The JP1 solder jumper must be soldered.
Figure 11 below shows the diagram of this input stage. A single-pole double-throw switch is connected to the micro-EMS PCB (not visible in the diagram), allowing the microcontroller to use either the VR sensor or the Tacho signal from the ignition units for its rev counter function.
The electronic ignition units of the MCR Sportster where the AvionicsDuino EMS is mounted are from the Ignitech company, model Sparker DC-CDI-P2. A resistor needs to load the Tacho output of these units. This is the role of R31 (470 ohms).
The signal from these units is quite noisy. It is roughly square, with an amplitude of about 15 volts across this 470-ohm load.
Fuel flow sensor input stage
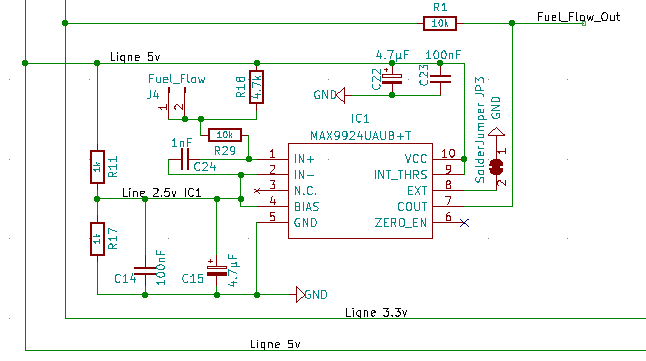
The Mode A1 configuration is also used, with a single input, and without any configuration jumper. The JP3 solder jumper must be soldered. See the diagram below (fig. 12).
The fuel flow sensor is a Red Cube FT-60 (Electronics International). This sensor has an open collector output, hence the pull-up resistor (R18, 4.7k) to the 5-volt line.
The signal from the Red Cube is also quite noisy, hence the need for this input stage, in order to avoid the supernumerary pulses (falsifying the calculation of the instantaneous fuel flow) that are ineluctably observed when directly connecting the Red Cube to the microcontroller, even when connecting it via an optocoupler. Furthermore, when the output transistor of the Red Cube is “ON” (conducting), the output voltage is not zero volts but rather around 0.2 to 0.3 volts; hence, the importance of Mode A1 with a trigger threshold shifted to 2.5 volts.
The reader is invited to refer to the Teensy micro-EMS page to learn more, especially with regard to flight test results.
Hi Tristan,
I’m not sure I understand your questions well.
In addition to carefully reading the MAX9924 datasheet, I would like to encourage you to read the detailed description of the MAX9924 evaluation kit very carefully. The necessary links are on the VR sensors page.
I’m afraid I can’t explain things more clearly…
This site is exclusively dedicated to avionics. We will not be able to help you with motorcycles.
Benjamin
Hi,
Great info, thank you. Please could you explain what the bias does to a noob like myself? The datasheet does not explain in a way that I understand. Does it limit the voltage into and in turn out the op-amp, which adjusts the comparator voltage range comparison? Can we adjust the COUT voltage? I hope to use the MAX9924 on a motorcycle flywheel VR sensor to an ESP32 which has 3.3v GPIO.
Thank you,
Tristan
Hi,
Please could you explain what the bias does to a noob like myself? The datasheet does not explain in a way that I understand. I hope to use the MAX9924 on a motorcycle flywheel VR sensor to an ESP32 which has 3.3v GPIO.
Thank you,
Tristan