(Flight Data Recorder: Last updated April 16, 2024)
With the aim of checking the validity of AvionicsDuino systems, we have successively developed two flight data recorders (FDR) to carry out the necessary analyses of the numerous parameters recorded during flight tests.
The first recorder
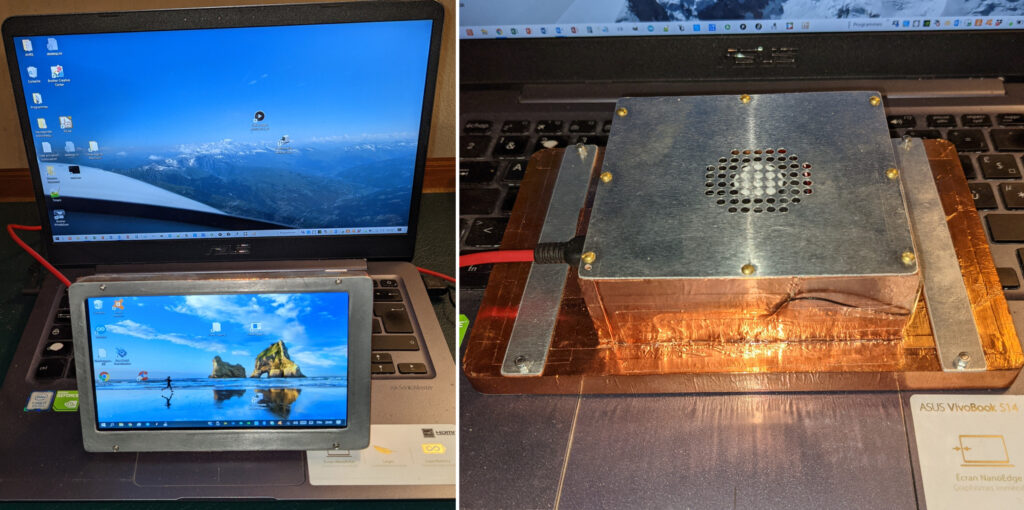
It is based on a LattePanda single-board computer running Windows 10 (4G / 64G SKU model: DFR0419), equipped with a 7 ″ IPS 1024 x 600 screen with a capacitive touch screen overlay (fig. 1). This data logger shares the same 5-volt power supply as the EFIS and EMS.
Actually, any laptop running Windows could be used instead of the LattePanda. The latter has the advantage of its tiny size. Several USB ports capable of emulating a serial COM port are required.
Operating principle
It is based on the continuous recording of UART or RS232 serial streams emitted by avionics systems, which must be programmed to emit such streams. These streams are received on the PC’s various USB COM ports.
Therefore, this first FDR can only be used with AvionicsDuino software versions that use the systems’ serial UART output (up to V2.5 for the EFIS and V1.5 for the EMS). For later versions, it will be appropriate to use the second flight data recorder (see below).
The software
The Windows program was written using the Processing Development Environment, based on the Java language. It allows simultaneous recording of serial data streams received by several USB COM ports.
Download here the Processing source code for the FDR. This program runs without modification on Windows; it could easily be adapted to other OS. If you don’t already have Processing on your laptop, you can download it here.
This program can simultaneously record in text files the output data from the EFIS and the EMS, as well as NMEA sentences (at best, GGA, RMC, and VTG) from a GPS/GNSS connected to another available USB COM port. Raw NMEA sentences can then be converted to any GPS track format (GPX, KML…etc.) with GPSBabel. These tracks can then be studied in Google Earth or any similar application.
This first FDR also allows recording the RS232 serial output (with the appropriate USB adapter) of the Dynon EFIS D10A, which is installed in the same aircraft as the EFIS AvionicsDuino. This allowed us to make numerous comparisons between the two EFIS; see the EFIS page.
If the FDR is running in administrator mode and a GPS/GNSS is connected, the PC’s system time is synced with the GPS time. Each line of each recorded file can be timestamped with the PC system time.
Software customization
Some customizations can easily be made to the source code. If you need a GPS, you can comment lines #156-157. If you need timestamping, you can uncomment line #325. You can edit lines #83-84 to select the folder and the name of the files where you want to record your data. A Windows 64-bit version of the executable files is downloadable here. This executable does not need a GPS and does not timestamp the data. If you need these functionalities, you have to modify the source code and rebuild the application.
The second recorder
Its principle is entirely different. It records all of the aircraft’s CAN bus traffic. To develop and implement it, it was first necessary to extend and substantially modify the CAN bus architecture, as explained on this page.
In its first architecture version, the CAN bus only connects four nodes and carries some data useful for the operation of the various connected systems. For example, the micro-EMS sends the fuel flow to the EMS, or the magnetometer module sends the magnetic heading to the EFIS. In this first version, the AHRS is not connected to the CAN bus but directly to the EFIS via a UART serial line.
From now on, with the second version of the CAN bus architecture, six nodes are connected (including the recorder), and all information regarding the flight or powertrain is continuously sent in real time over the CAN bus. Thus, all the parameters of the aircraft can be recorded continuously and then analyzed from the desktop at home. An obvious practical application of these recordings concerns, for example, the study of aircraft performance.
This second recorder can only be used with software versions that exploit the new extended six-node CAN bus architecture: from V3.01 for the EFIS and V1.7 for the EMS. For earlier software versions, the initial simplified CAN bus architecture (only four nodes) and the first flight recorder should be used, as seen above.
Operating principle
The new FDR is based on an ESP32 board coupled with a micro-SD card reader. The goal is to be able to recover the saved files at the end of the flight without a wired connection, using a simple smartphone or tablet via the Wi-Fi access point generated by the FDR. The heart of the system is an Arduino Nano ESP 32 board (see the page on microcontroller boards), coupled with a micro-SD card adapter and a CAN transceiver. The recorder is connected to the aircraft CAN bus via a 9-pin D-SUB socket, like any other CAN node.
This board is the first in the Arduino family to be based on an Espressif ESP32-S3 microcontroller in the form of a u-blox® NORA-W106 module. The clock frequency is 240 MHz. There is 384 kB of ROM, 512 kB of SRAM, and 16 MB of external flash memory. The main feature of this board is its WiFi and BlueTooth LE connectivity, which is why we selected it.
Practical realization
The circuit diagram is shown in Figure 2 below.
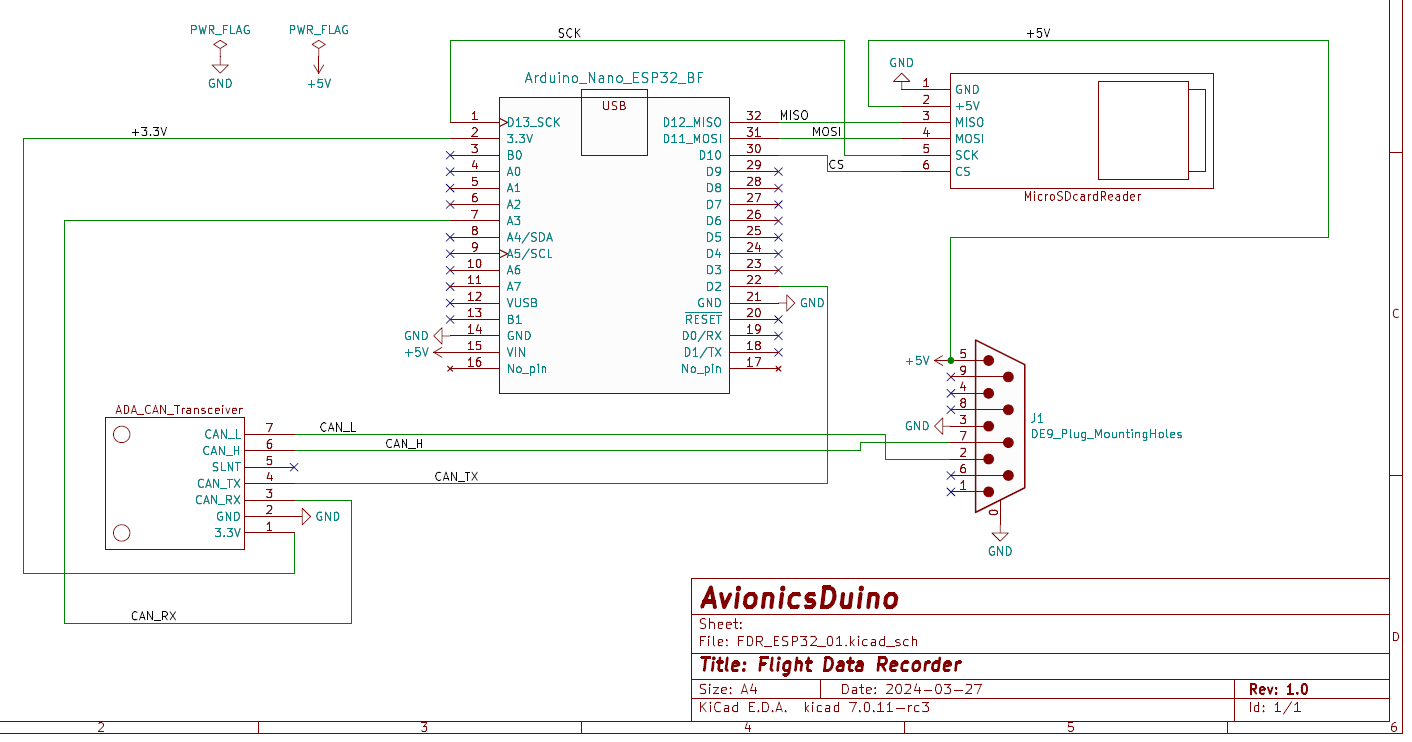
Figure 3 shows the printed circuit board with its daughter boards and connector. To save space, the CAN transceiver is placed on the opposite side of the Arduino board and the micro-SD card reader module.
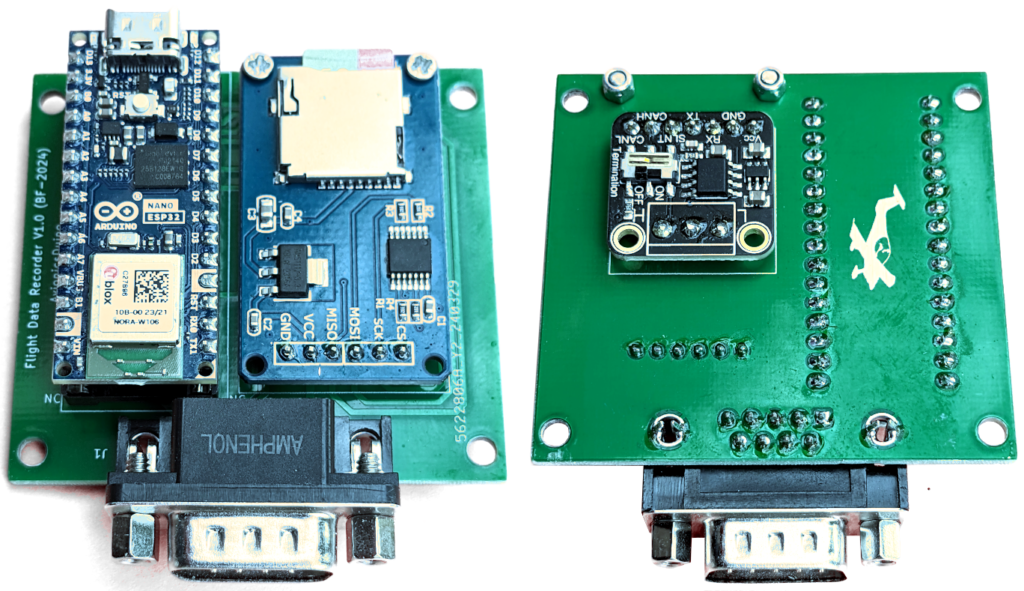
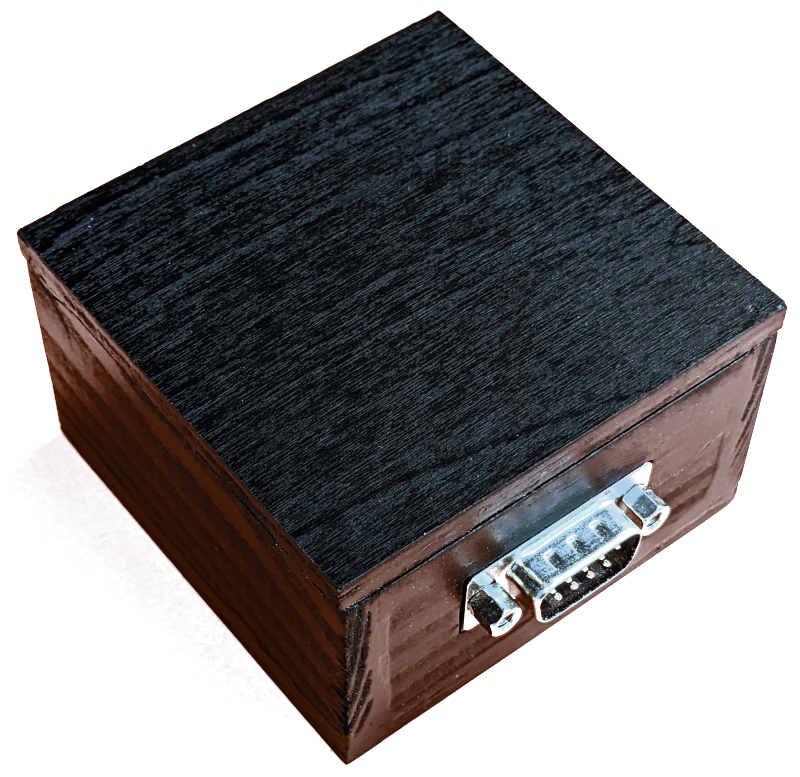
Figure 4 below shows the recorder in the prototype enclosure used for flight testing.
Files to download
Software
It is downloadable on GitHub. The principle is simple: the binary data received from the CAN bus is converted into text format and sent to a circular buffer. This buffer is then written in successive packets of 512 bytes on a micro SD card, which optimizes the writing operations to avoid latencies linked to the SD card.
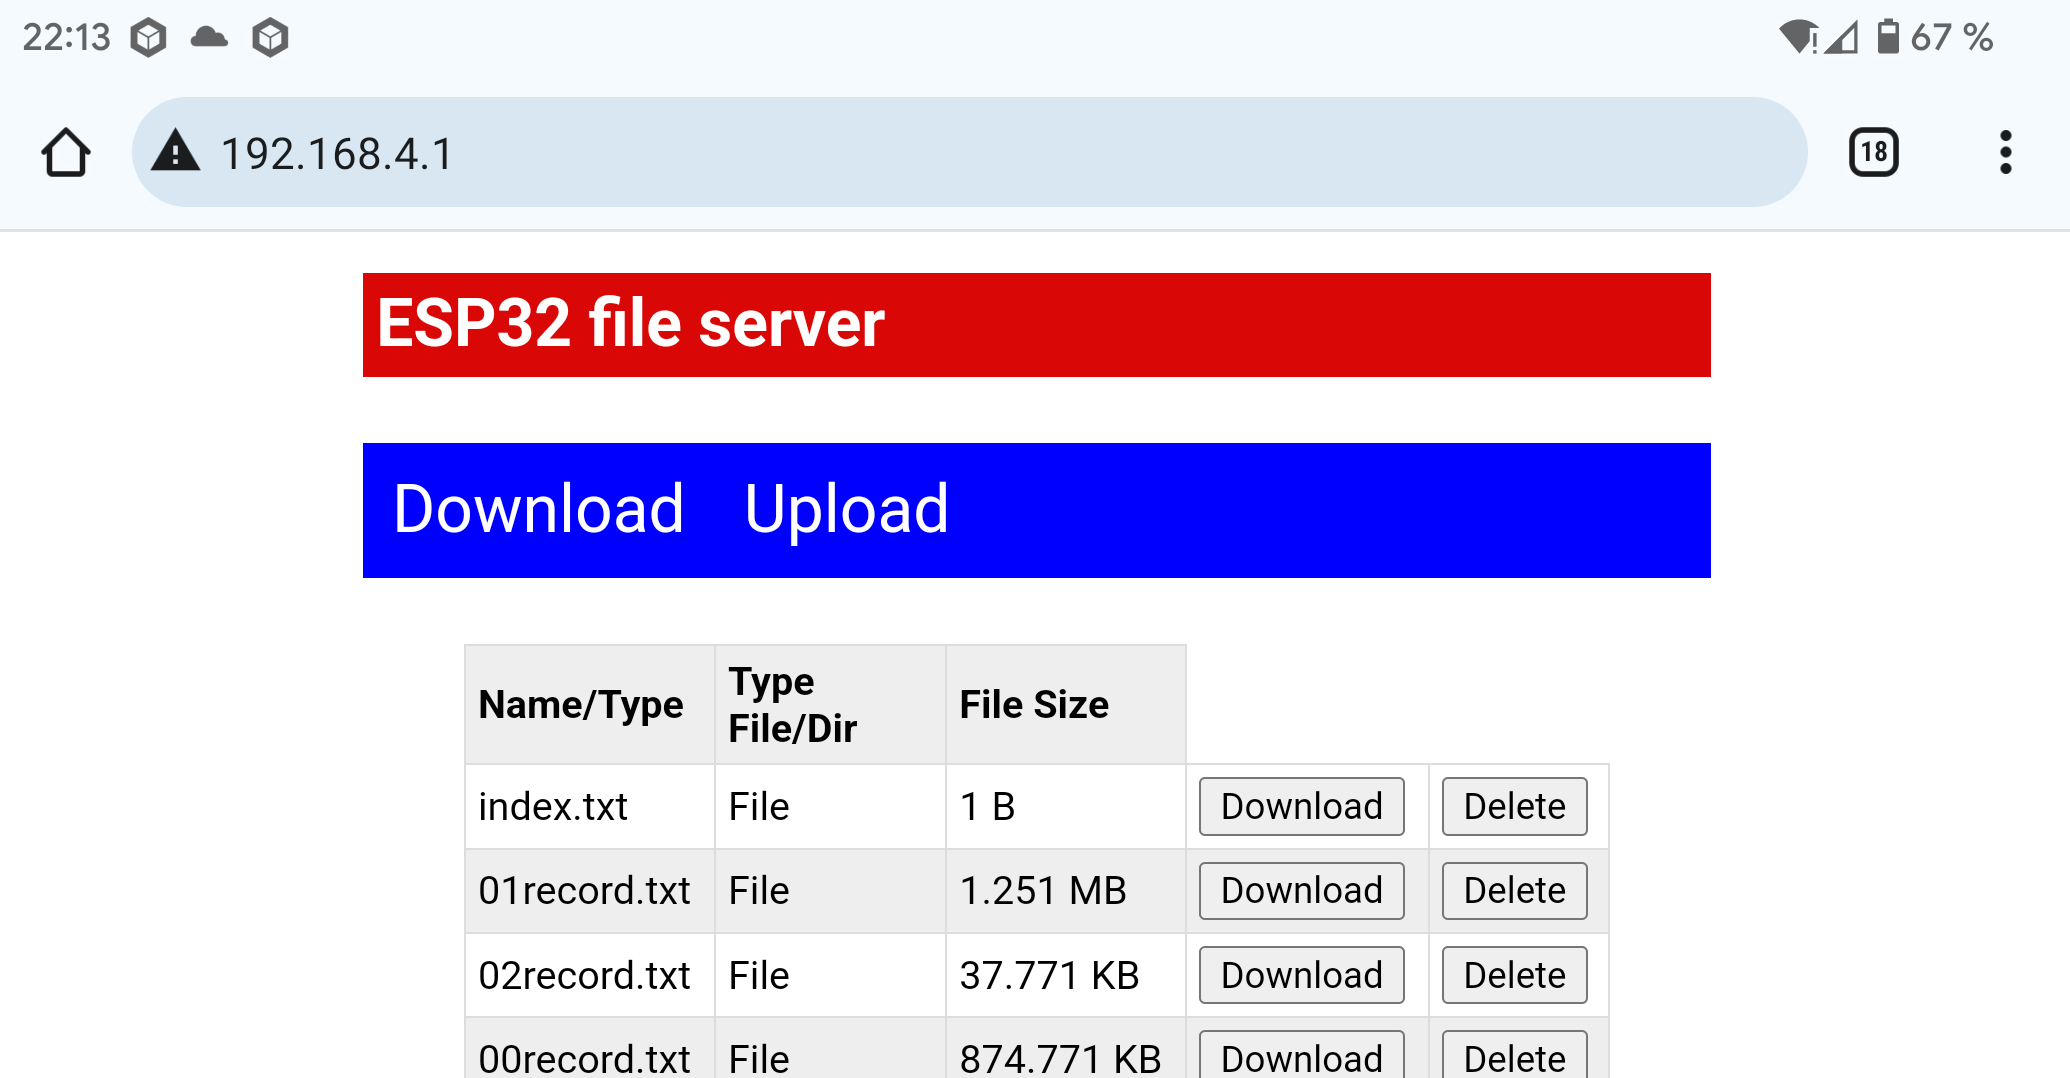
The recorder software generates a Wi-Fi access point to which a smartphone or tablet can be connected. By opening the web application created by the FDR server with an internet browser, you can download (or delete) the files saved on the micro-SD card (fig. 5).
The flight tests were very satisfactory. The recorded files complied with expectations and with the traffic on the CAN bus. We have never experienced any data loss.
The analysis possibilities are almost endless. For example, the recorded text files include all the necessary elements to generate a GPS track that is viewable, for example, on Google Earth. To do this, you must import the raw text data into a spreadsheet such as Microsoft Excel, then select the desired columns, and make an export to CSV format.
The CSV file can then be used by GPSBabel and converted, for example, to the KML format of Google Earth. To generate the CSV file, and in particular, to assign the right names and units to the different fields, the reader can usefully consult this GPSBabel help page, where the format “Universal csv with field structure in first line (unicsv) ” is described in detail.
We could multiply the analysis examples. The contribution of a spreadsheet allowing you to import text data with fields separated by semicolons is invaluable. All kinds of graphs can be drawn to show the evolution of different parameters or to compare them from one flight to another, for example, according to different settings made to the engine or to the airframe or according to the flight conditions, altitude, engine power, etc.
These first tests showed that it is not desirable to record filtered data but rather raw data. Indeed, filters greatly improve the display stability and the readability of the information on the screens, but they inevitably induce a phase shift, which is detrimental to the analysis of the recordings (see the page on digital data filtering techniques).
Therefore, updates to the software of the different nodes have been carried out: except for some slowly varying data, such as temperatures, the sending nodes now transmit raw data to the CAN bus, and the filters, when necessary, are applied by the recipient nodes. Nodes must all use the very latest versions of software published on GitHub.
A disappointment linked to this software is the low Wi-Fi access point speed, which makes it quite tedious to download a file of only a few megabytes on a smartphone or tablet. Approximately 5 MB of data is generated per hour of flight. We have not yet succeeded in identifying the causes of this low speed and to address this issue.
For this reason, we have installed the FDR in a very accessible location on the CAN bus (with Velcro under the dashboard in our case, but this could have been under a seat or, in fact, at any point on the CAN bus). This allows us to unhook the recorder and disconnect its D-SUB socket in a few seconds at the end of the flight to take it away with its micro-SD card. Although this is not as satisfactory as expected, the most important thing is the perfect quality of the recordings.